Manufacturing, operations, service or product executives know all too well the intense pressure to optimize asset utilization, budgets, performance and service quality. It’s essential to gaining a competitive edge and driving better business performance.
The question is, how can these goals be achieved? By quickly delivering high-impact data projects that help them achieve their goals. Armed with the right solutions, they can analyze product availability and predict product failures before they occur, optimize existing infrastructure to increase up-time, and reduce operational and capital expenditures. And they can better meet service level agreements by proactively identifying and fixing potential issues before real problems occur.
The key is unlocking insights buried in log, sensor and machine data – insights like trends, patterns, and outliers that can improve decisions, drive better operations performance and save millions of dollars. Servers, plant machinery, customer-owned appliances, cell towers, energy grid infrastructure, and even product logs – these are all examples of assets that generate valuable data. Collecting, preparing and analyzing this fragmented (and often unstructured) data is no small task. The data volumes can double every few months, and the data itself is complex – often in hundreds of different semi-structured and unstructured formats.
Why Big Data Analytics?
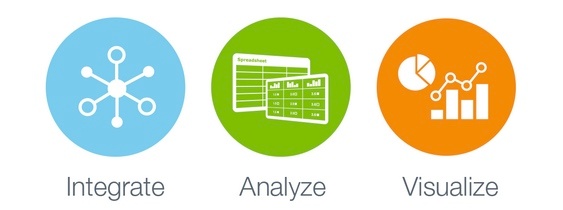
Running a Data Discovery and Visualization Tool against your Data Lake is the answer. It’s so powerful because it enables you to combine, integrate and analyze all of your data – regardless of source, type, size, or format. For example, you can quickly grab structured data such as CRM, ERP, mainframe, geo location and public data and combine them with unstructured data such as network elements, machine logs, and server and web logs. And then, using the right analytical tools, you can use this data to detect outliers; run time series and root cause analyses; and parse, transform and visualize insights from your data.
For example, you can use customer and device usage across networks to identify high-value usage. Or correlate operational, usage and cost data across operations to identify low-value segments. You can integrate and analyze historic machine data and failure patterns to predict and improve mean time-to-failure – or ERP purchase data and supplier data to optimize supply chain operations. And you can use sensor and machine data to identify and resolve network bottlenecks. The possibilities are endless.

Source: Datameer


